

Creating a View
Ask Orion in chat for the dataset you want to keep, or save one an analysis already produced:- “Save this joined table as a view I can build on”
- “Create a view of orders and customers for the last 12 months”
Finding Your Views
Open the project’s Metrics page and select the Views filter, which lists views only. The All filter leaves views out, so a view you just created does not appear there. See Metrics for the rest of the filter bar.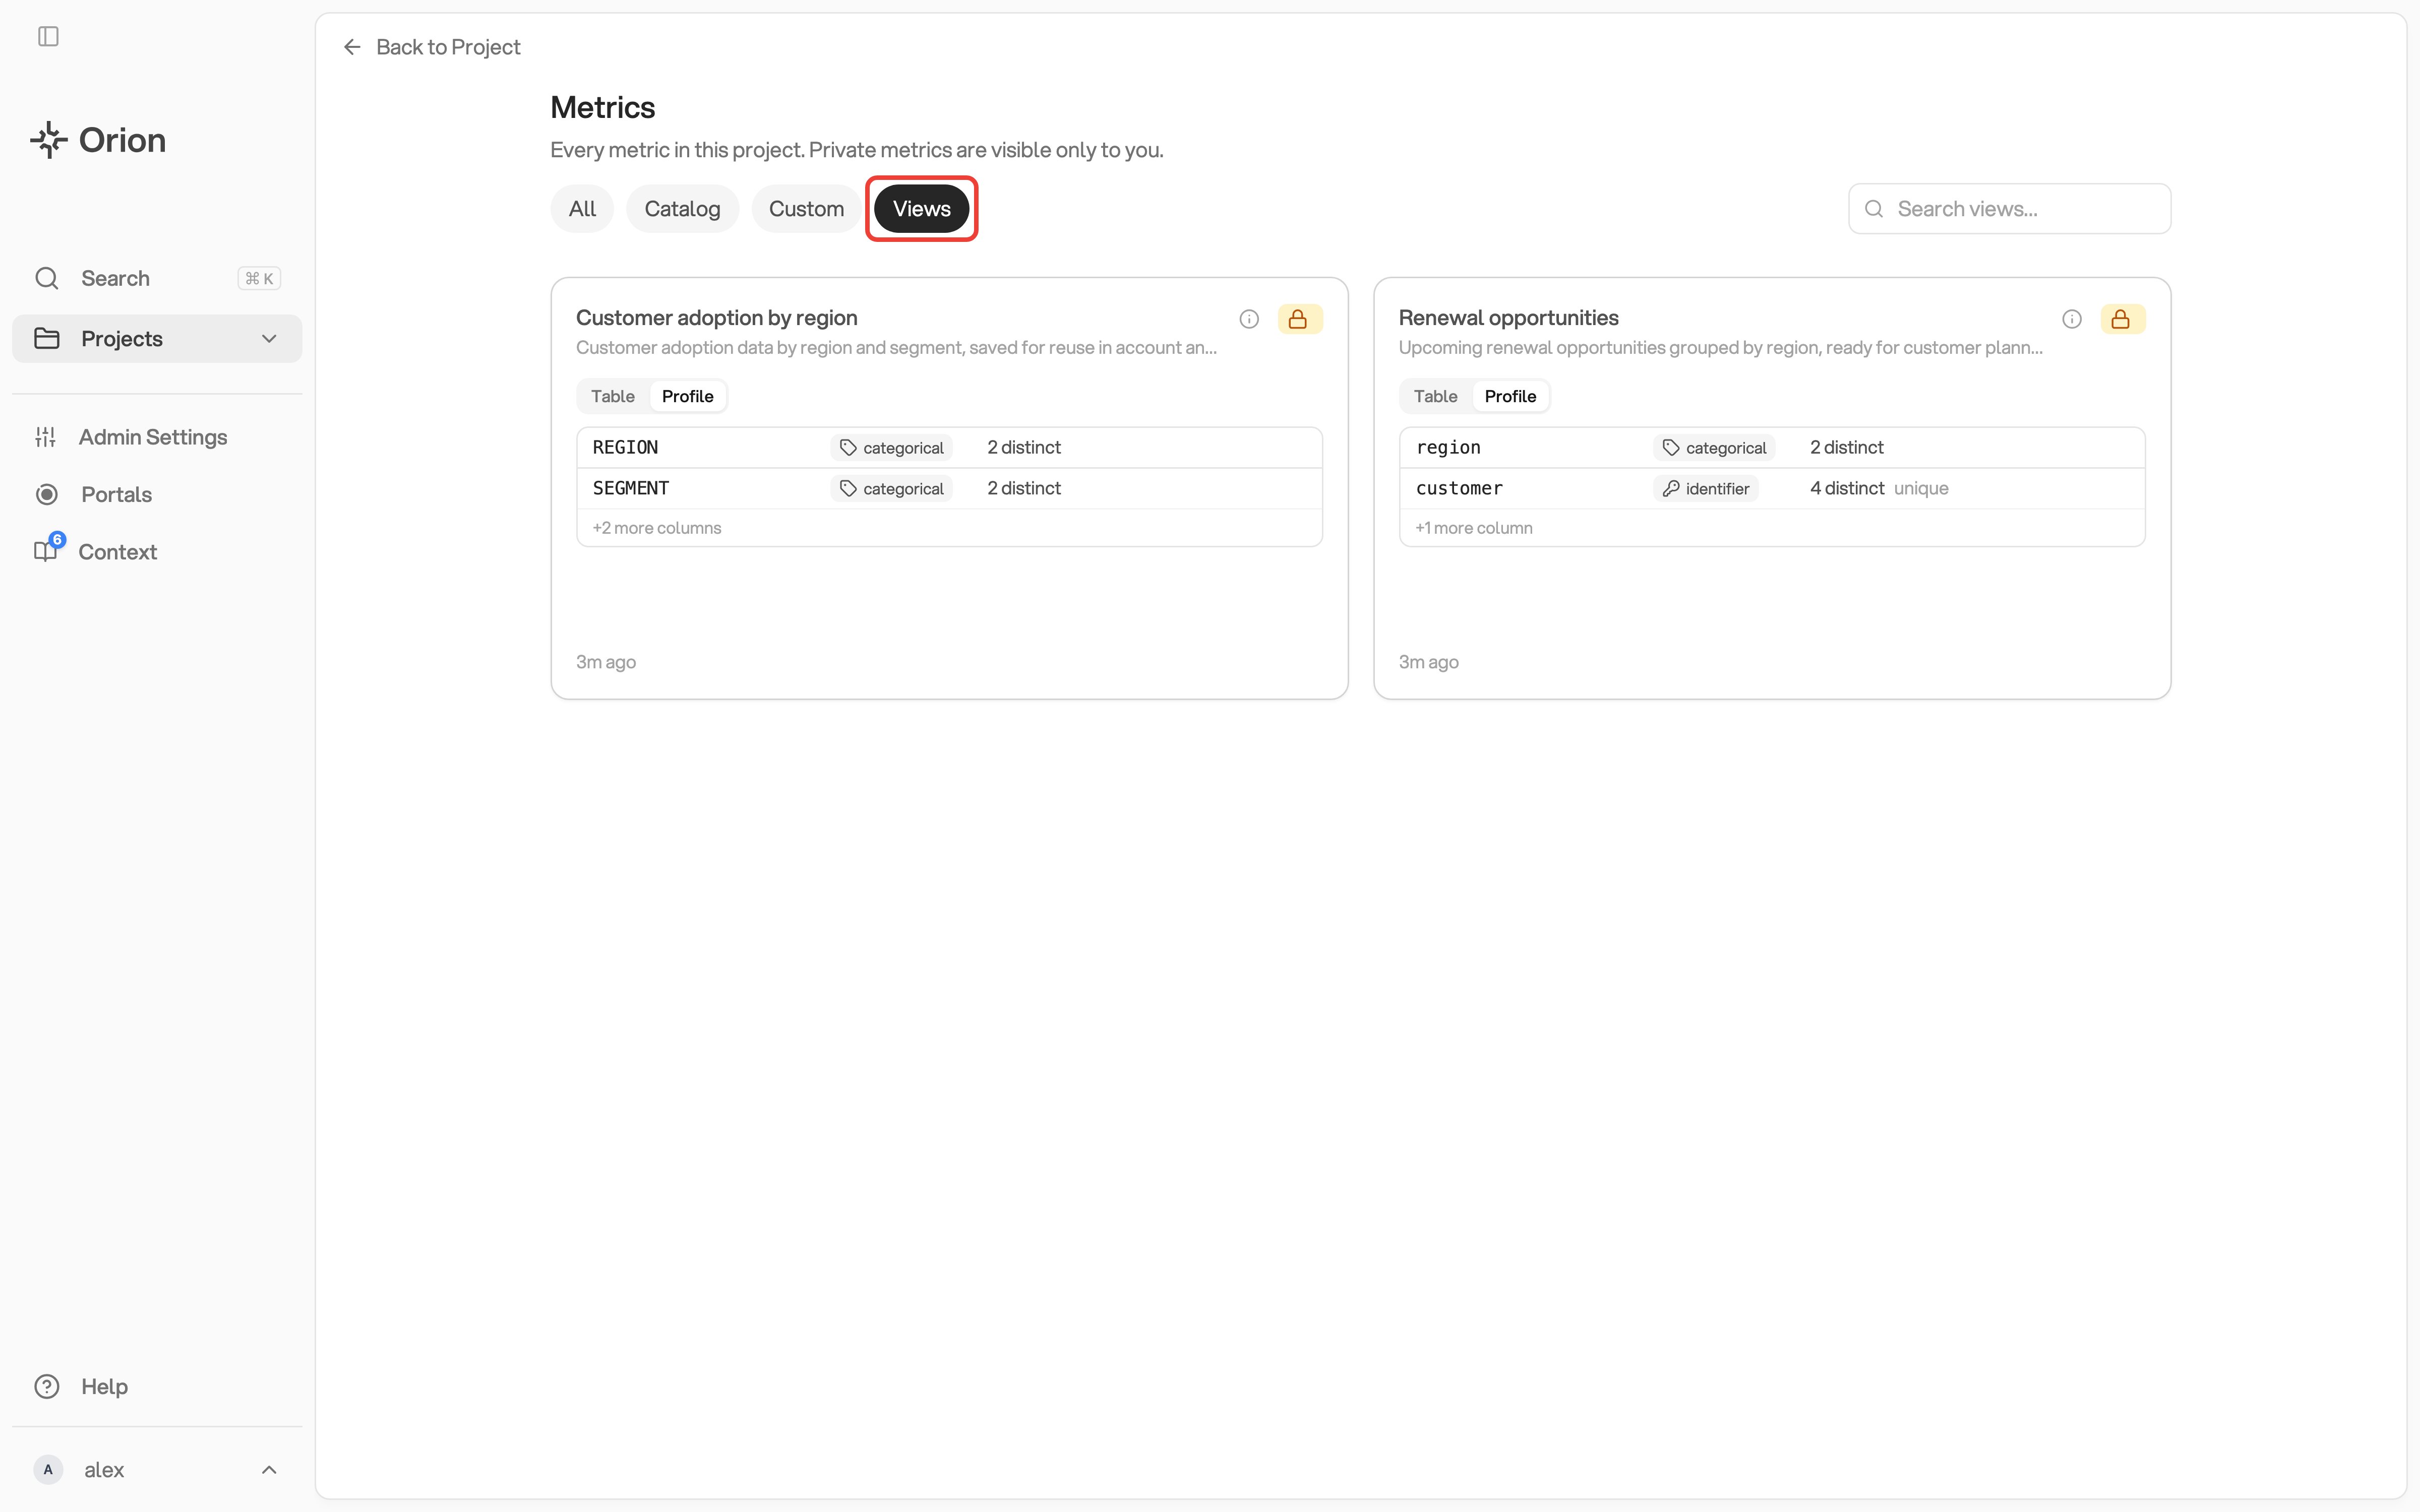
Find saved datasets with the Views filter
Reading a View’s Result
A view opens in the same detail sheet as a metric, on the Profile tab. Profile summarizes each column: ranges, common values, and missing values. Table shows a preview of the saved rows rather than the whole dataset. The sheet offers no full-table grid and no CSV export, so to work with every row, bring the view into an analysis. When a rollup panel appears below the result, choose columns under Group by and pick a Measure. Orion aggregates every saved row, including rows outside the preview. Use it to check a view before you build on it.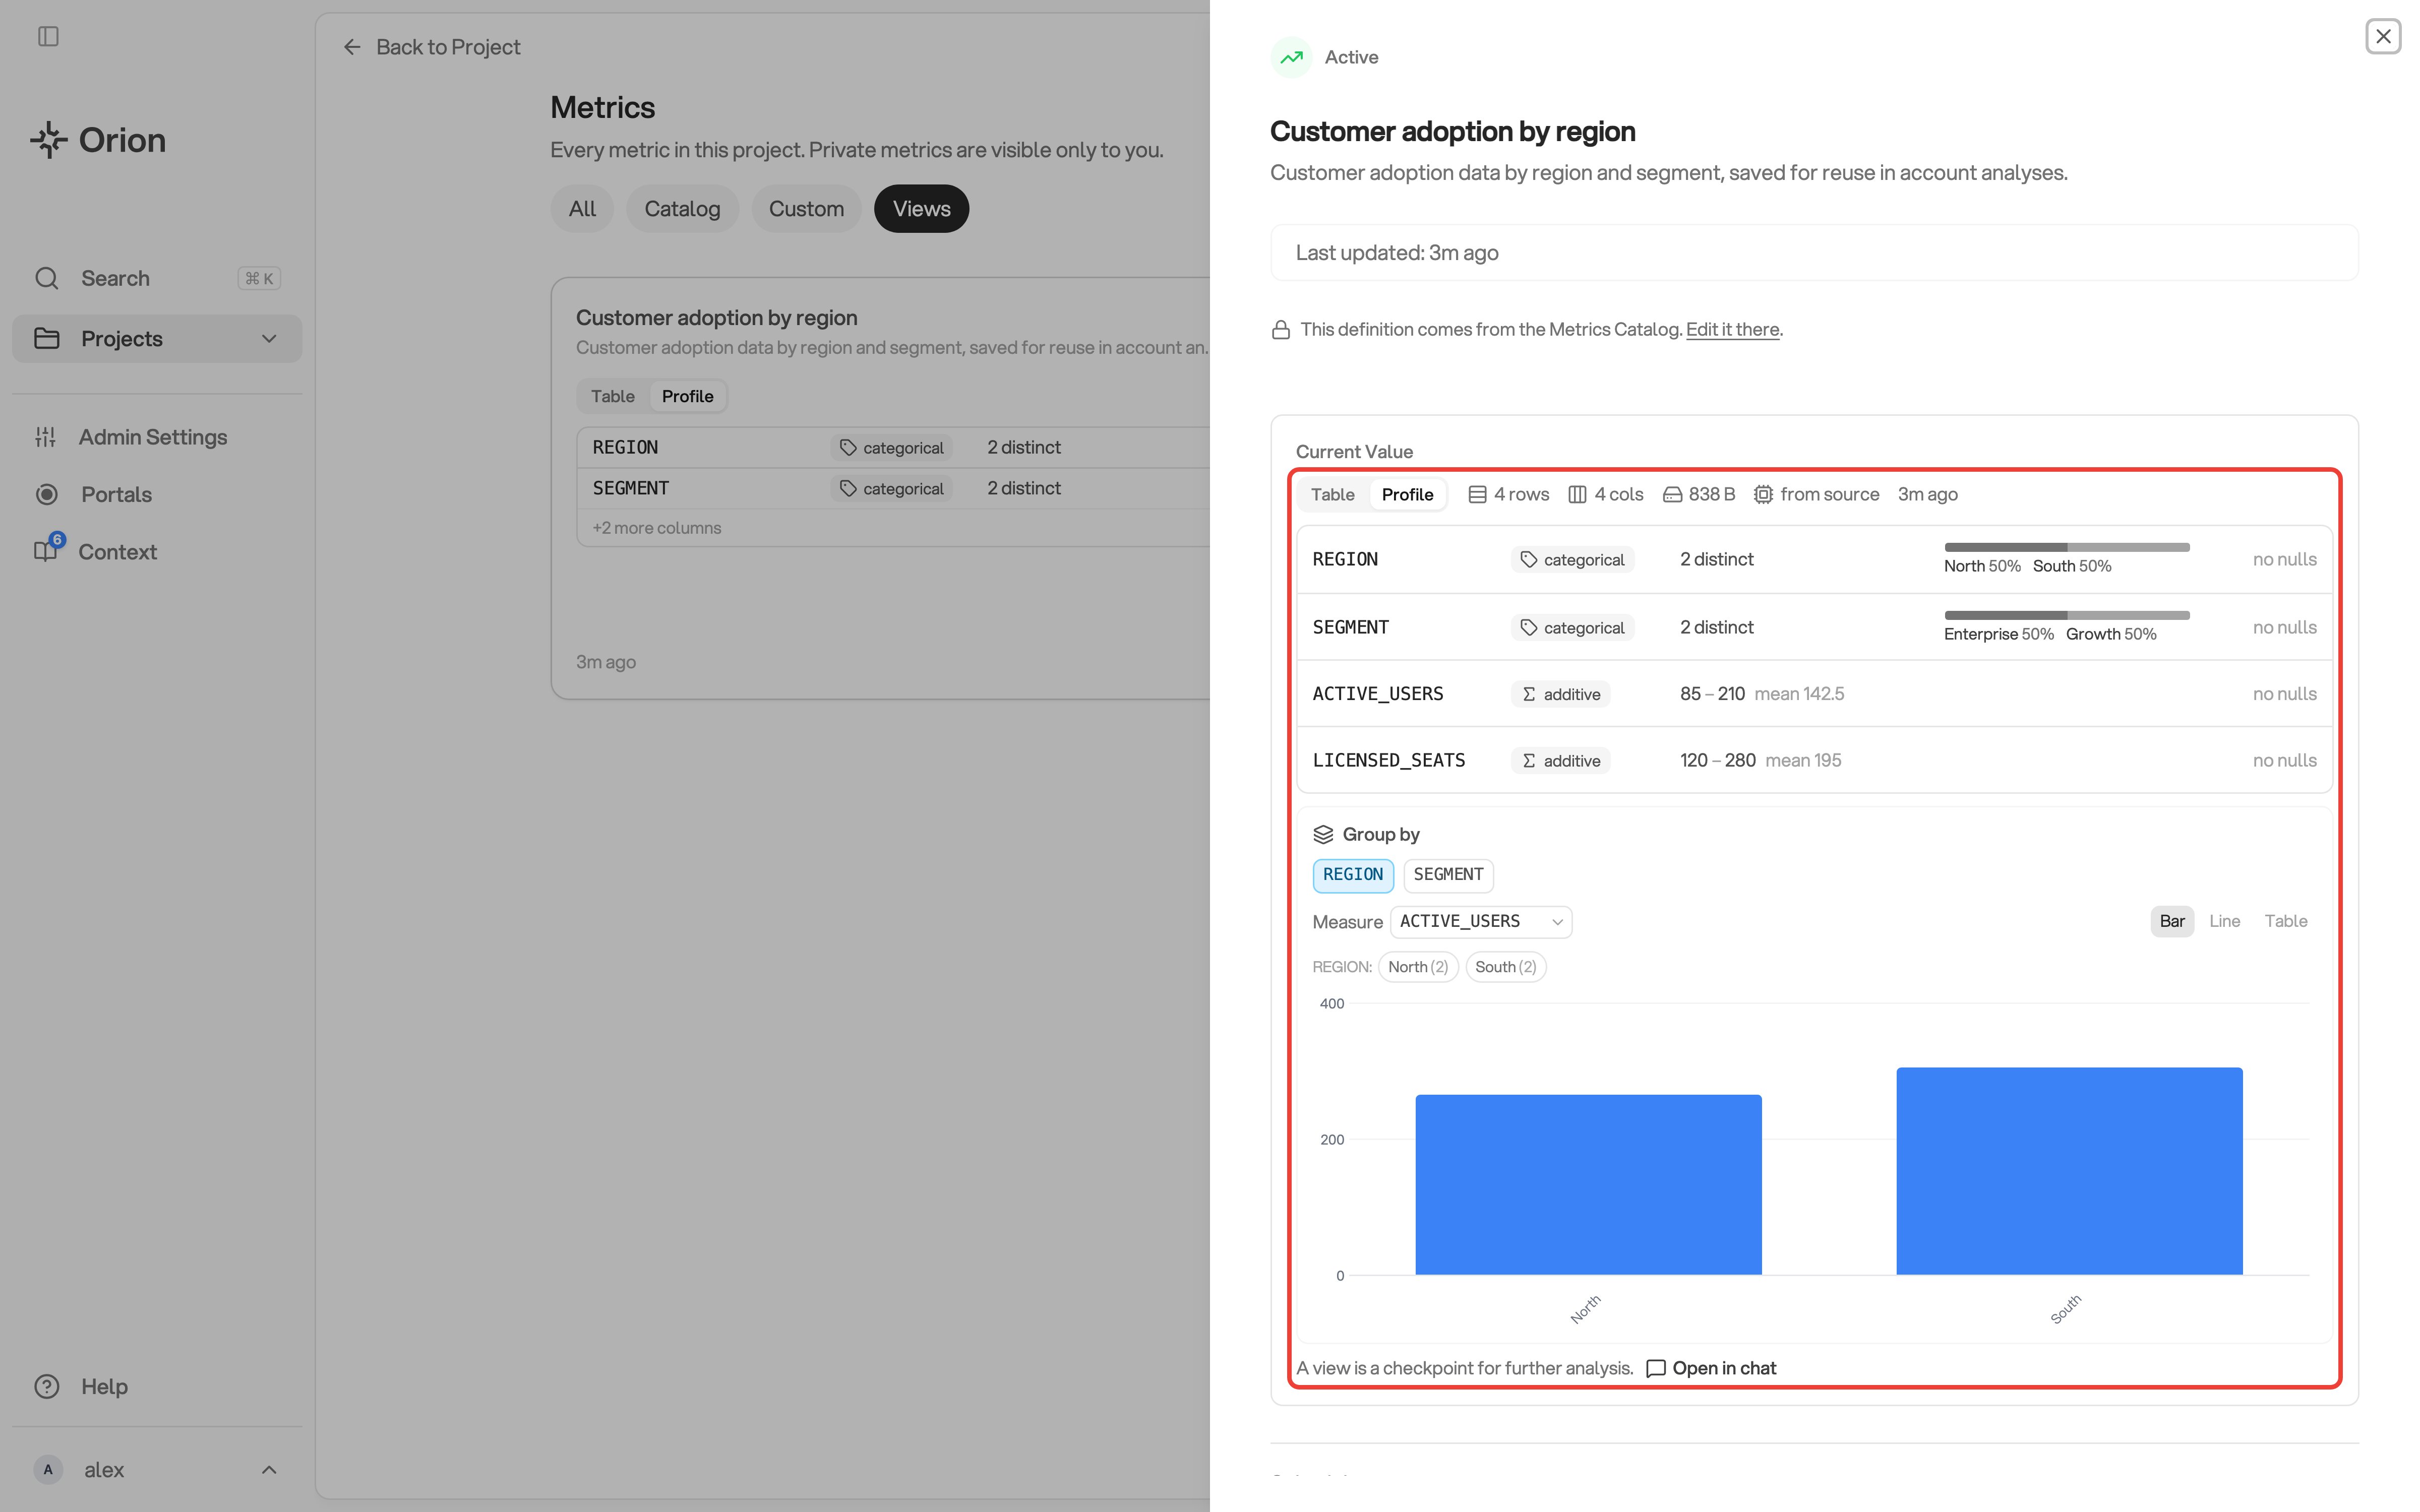
Inspect columns and summarize a saved view
Slicing a View
A slice is one question asked of a view, written as a single line. It names the measures, how to group them, the filters, and an optional time window or comparison.Slices are available on select workspaces. Ask your Gravity contact to enable them.
When a Slice Ends Before Your Newest Rows
A view whose newest rows are still loading has an incomplete tail. Where Orion finds one, a slice with a time window or a comparison ends at the last complete period rather than at the latest data. A part-loaded week otherwise reads as a real fall. The Time window control in Explore then lets you choose between the last complete data and the latest data. See Where a Time Window Ends. Where the detection is wrong, ask Orion to set the day the view is complete through. For a view that loads without lag, ask Orion to stop the check.Correcting What Orion Infers About a View
The frame comes from the column profile, so parts of it can land wrong. Ask Orion in chat to correct any of these. A view with more than one date column still gets one primary date, and date filters, windows andweek(...) all follow it. Orion can pick the wrong one. Ask Orion to make the other column the view’s time column.
A stored count reads as a number that adds up. A per-day distinct count does not: summing it across days counts the same person twice. Ask Orion to mark that measure as one that must not be summed. It then refuses :sum, :mean and :avg, so slice it with :max or :min, or at the view’s grain. Orion refuses the change while dashboard cards still sum that measure, and names those cards, so repoint them first.
A numeric flag can land as a measure rather than as a field you group by. Ask Orion to expose it as a groupable field.
Reusing a View
A saved view becomes an input for other work:- Ask Orion to build another view or a metric from it, and the new one reads the view’s saved rows
- Use the chat’s
@menu to select an available project view
Sharing a View Across Projects
A view belongs to the project that created it. To let other projects build on it, add it to the Metrics Catalog. Open the view from the Metrics page and select Add to catalog in its detail sheet. You can also ask Orion to share a view, and it confirms with you before sharing. Sharing does not take the view away from the project that created it. That project keeps using it. To reference a shared view, open the other project’s Project Settings and select the Views tab: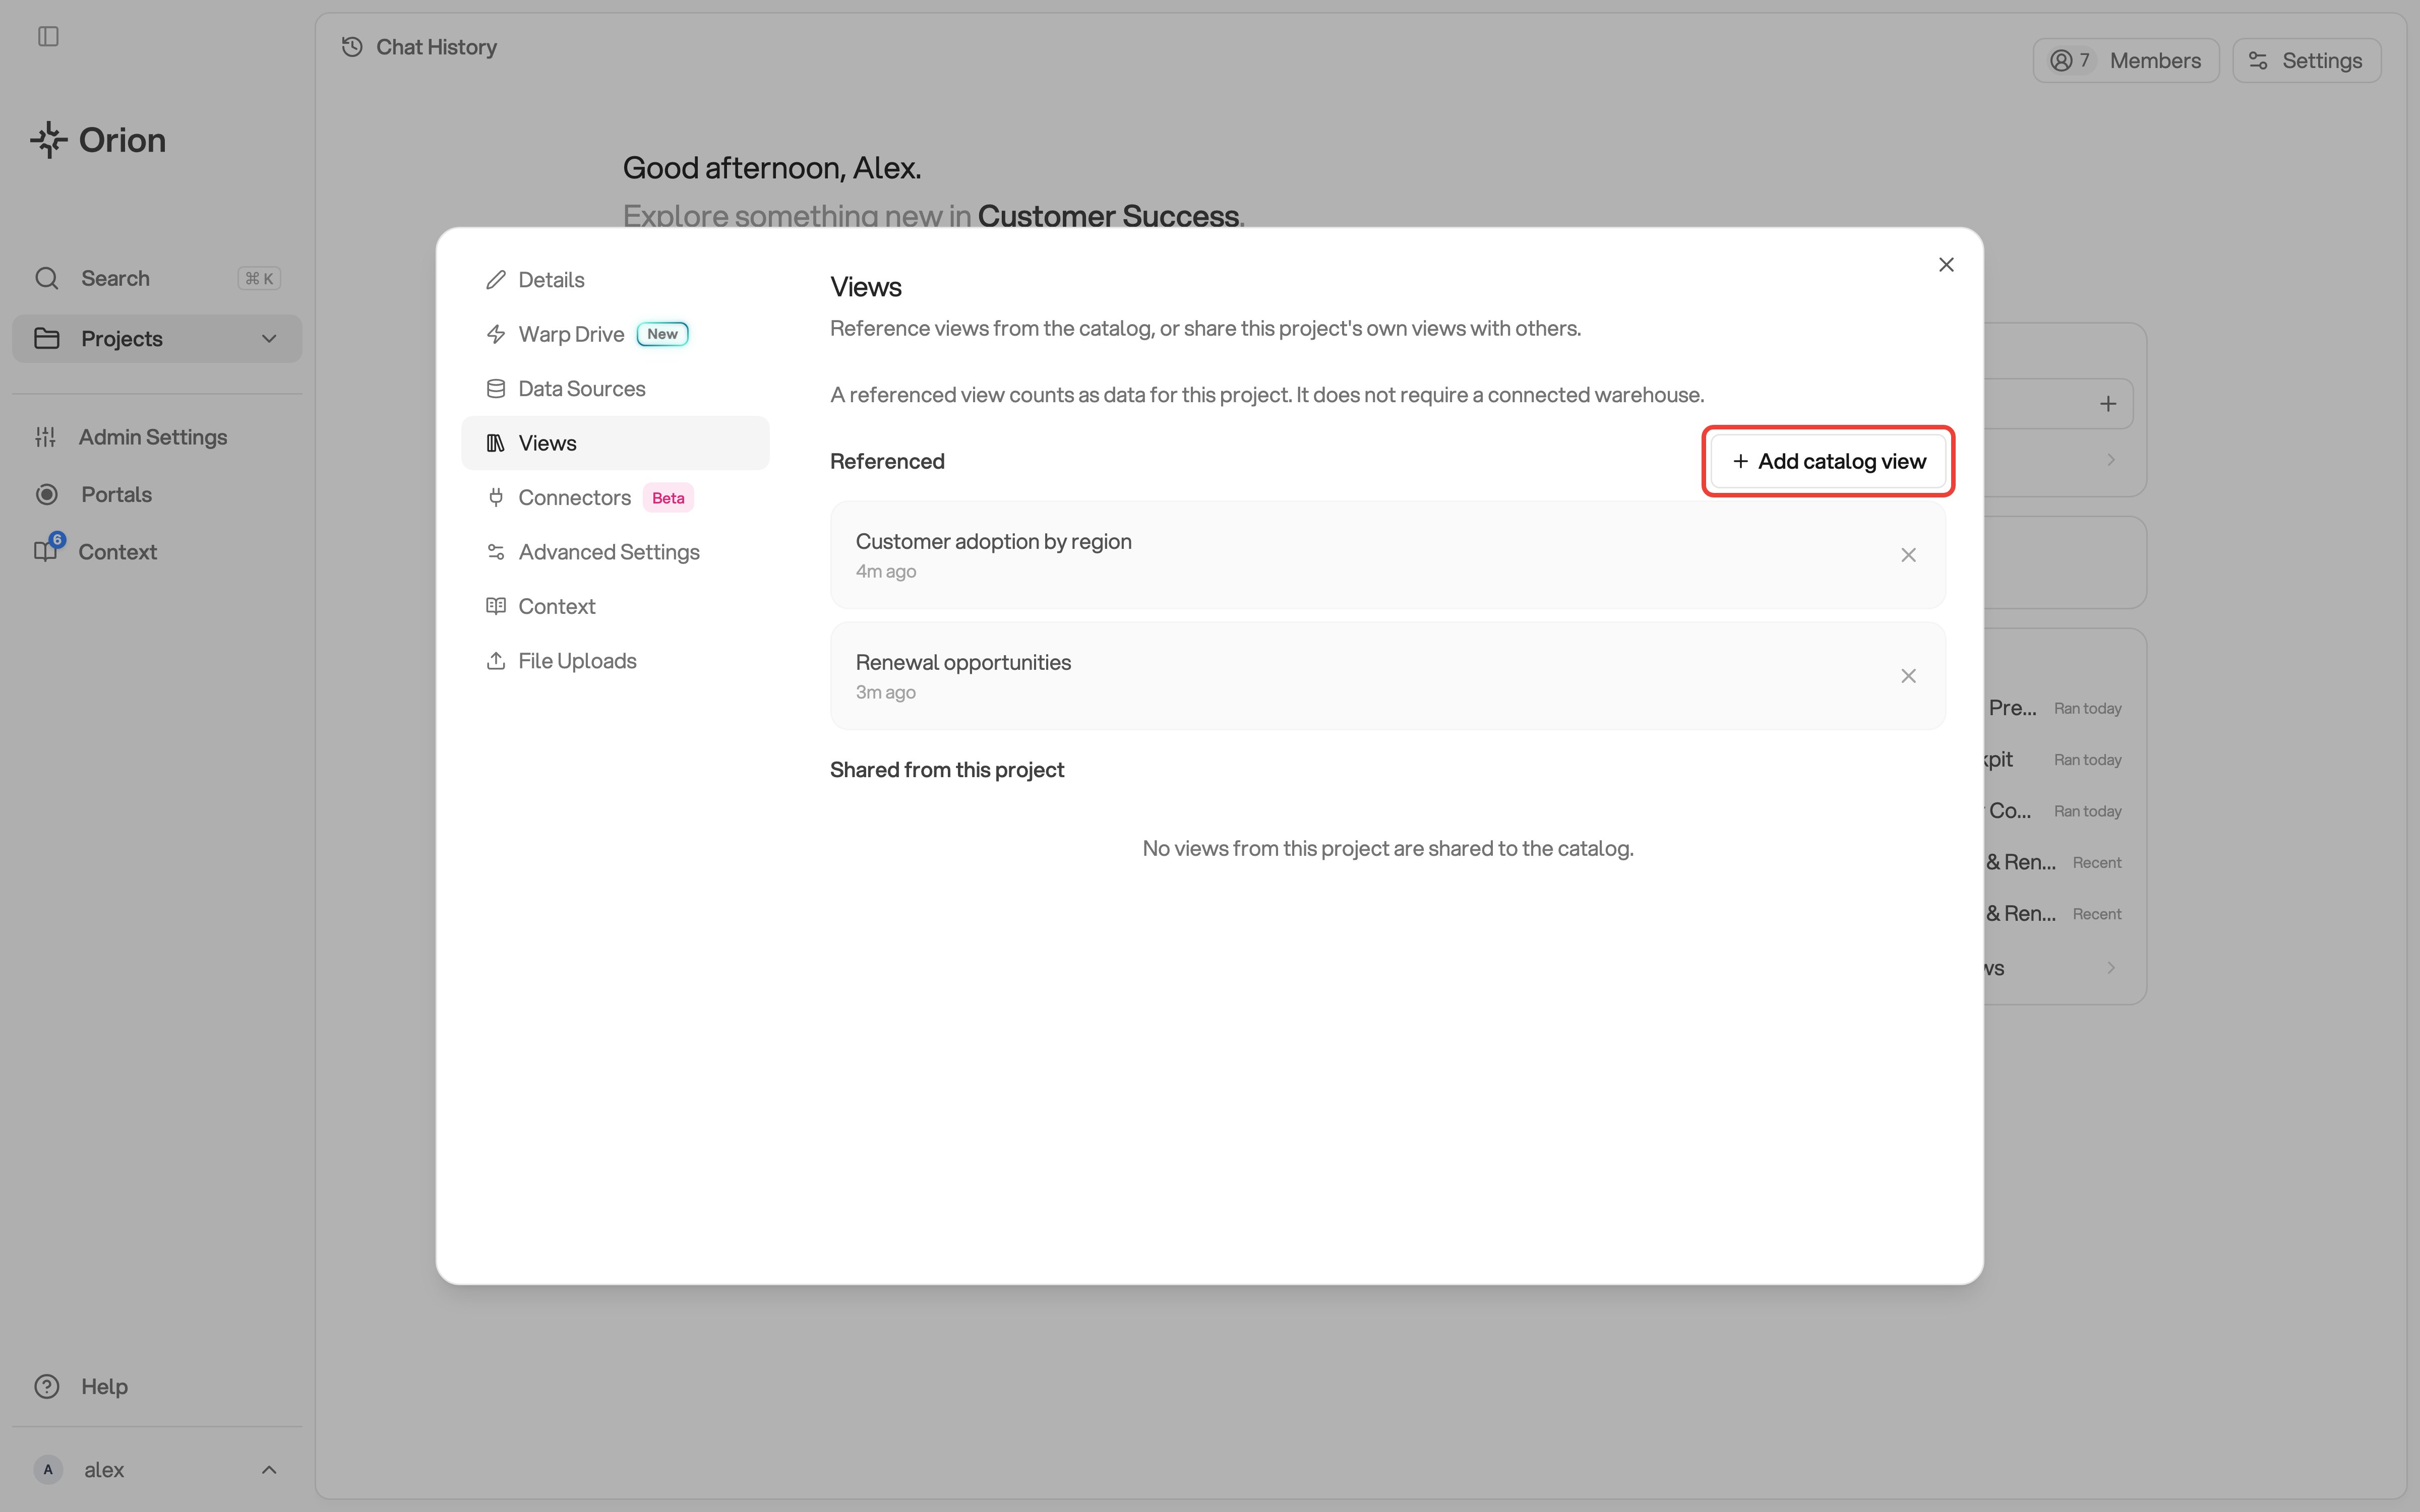
Manage view references in Project Settings
- Select Add catalog view
- Search for the view by name
- Select Add on its row
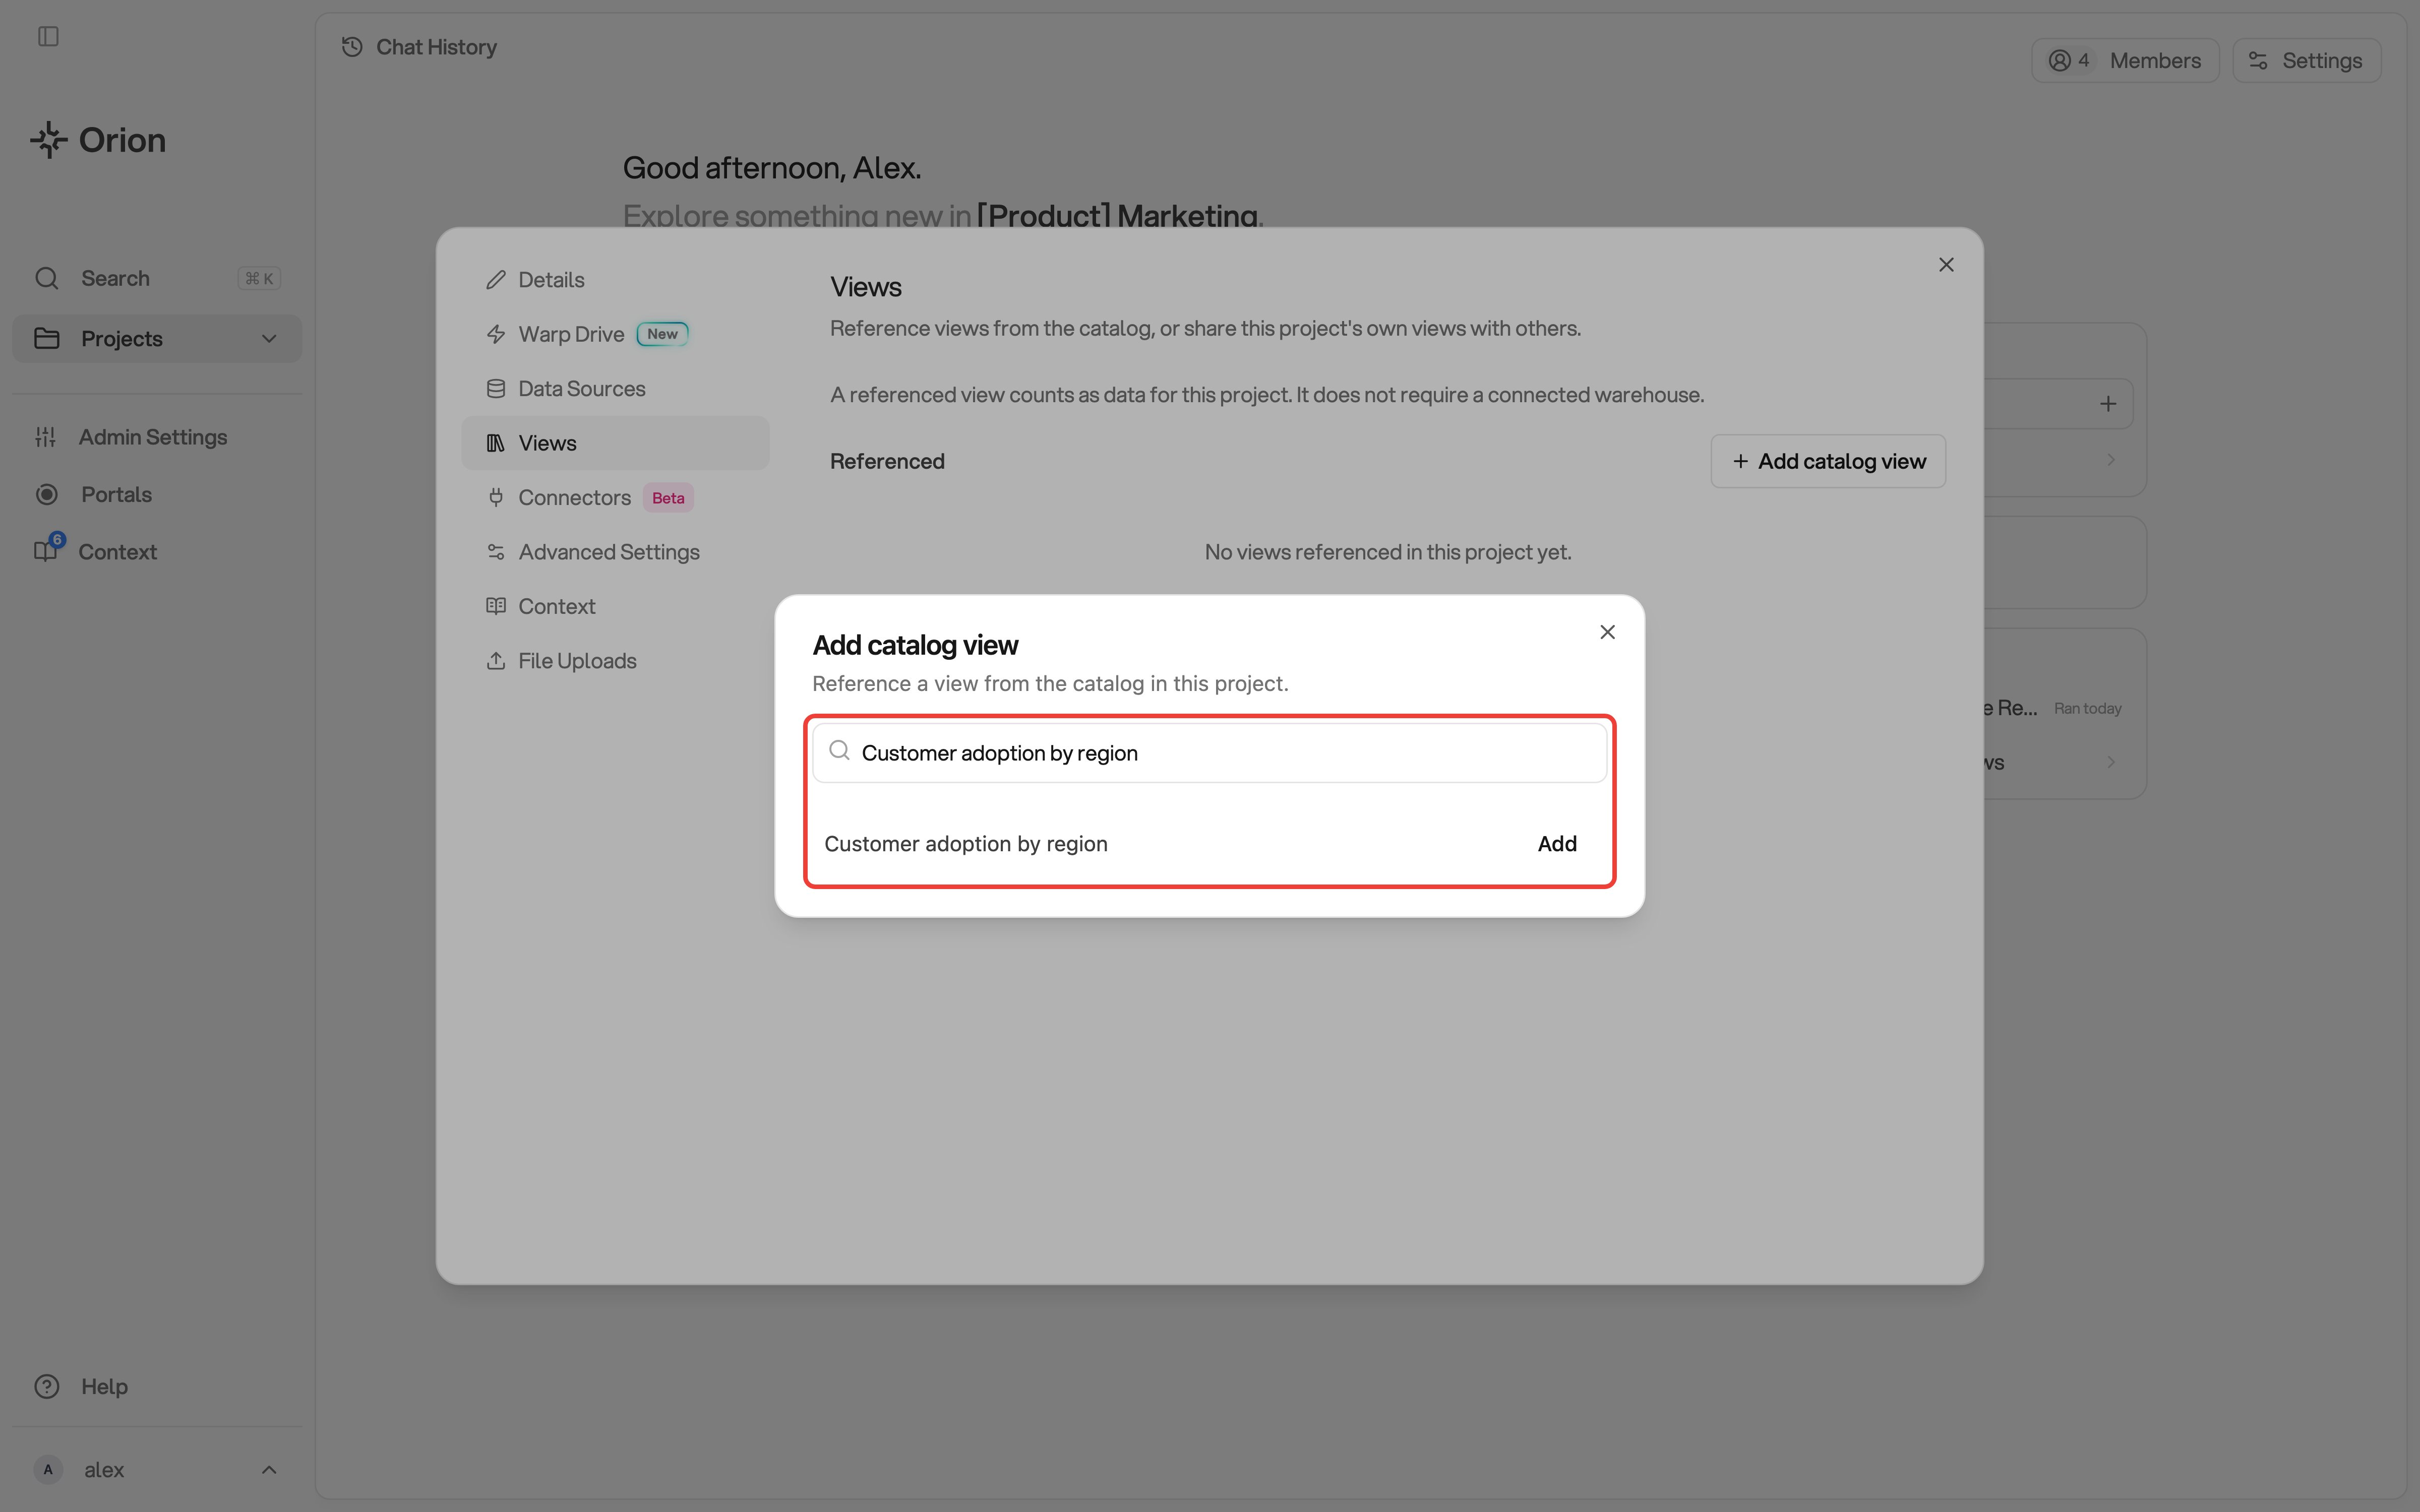
Find a catalog view to add to the project
Removing a Referenced View
Open the Views tab and use the remove control on the view’s row under Referenced. The project is disconnected from the catalog view. Nothing is deleted, and other projects referencing the same view keep theirs. Orion refuses the removal while something in this project still reads the view, and names what. Remove or repoint those first, then remove the reference.Removing a reference removes the view for everyone in the project.
Who Can Use Views
- Viewers: read a view’s result when project access and any catalog group restrictions allow it. Run, schedule, code, and delete controls are unavailable
- Analysts: create, run, edit, and share views, and add or remove references on the Views tab
- Admins: do all of that for any view in the workspace
A viewer holding a Group Analyst or Group Admin seat acts with that higher
role in the projects they reach through it.