

The Detail Sheet
From top to bottom:- State and visibility - The state pill (Active, Paused, Error, Draft) and the Shared/Private toggle
- Name and description - Click the name to rename it inline
- Add to catalog - Promotes the metric to the Metrics Catalog, so other projects can use the same definition
- Run Now - Executes the metric immediately. Most runs finish within a minute. Slow ones keep running in the background
- Current Value - The latest result, rendered per the metric’s visualization
- Schedule - When the metric refreshes automatically
- Historical Results - Up to 20 recent runs, expandable for table results
- Used by - What reads the metric, shown when anything does, so the effect of a delete is visible before one is attempted
- Query & Code - The sources and transformation behind the value
- Delete - Removes the metric and its entire run history
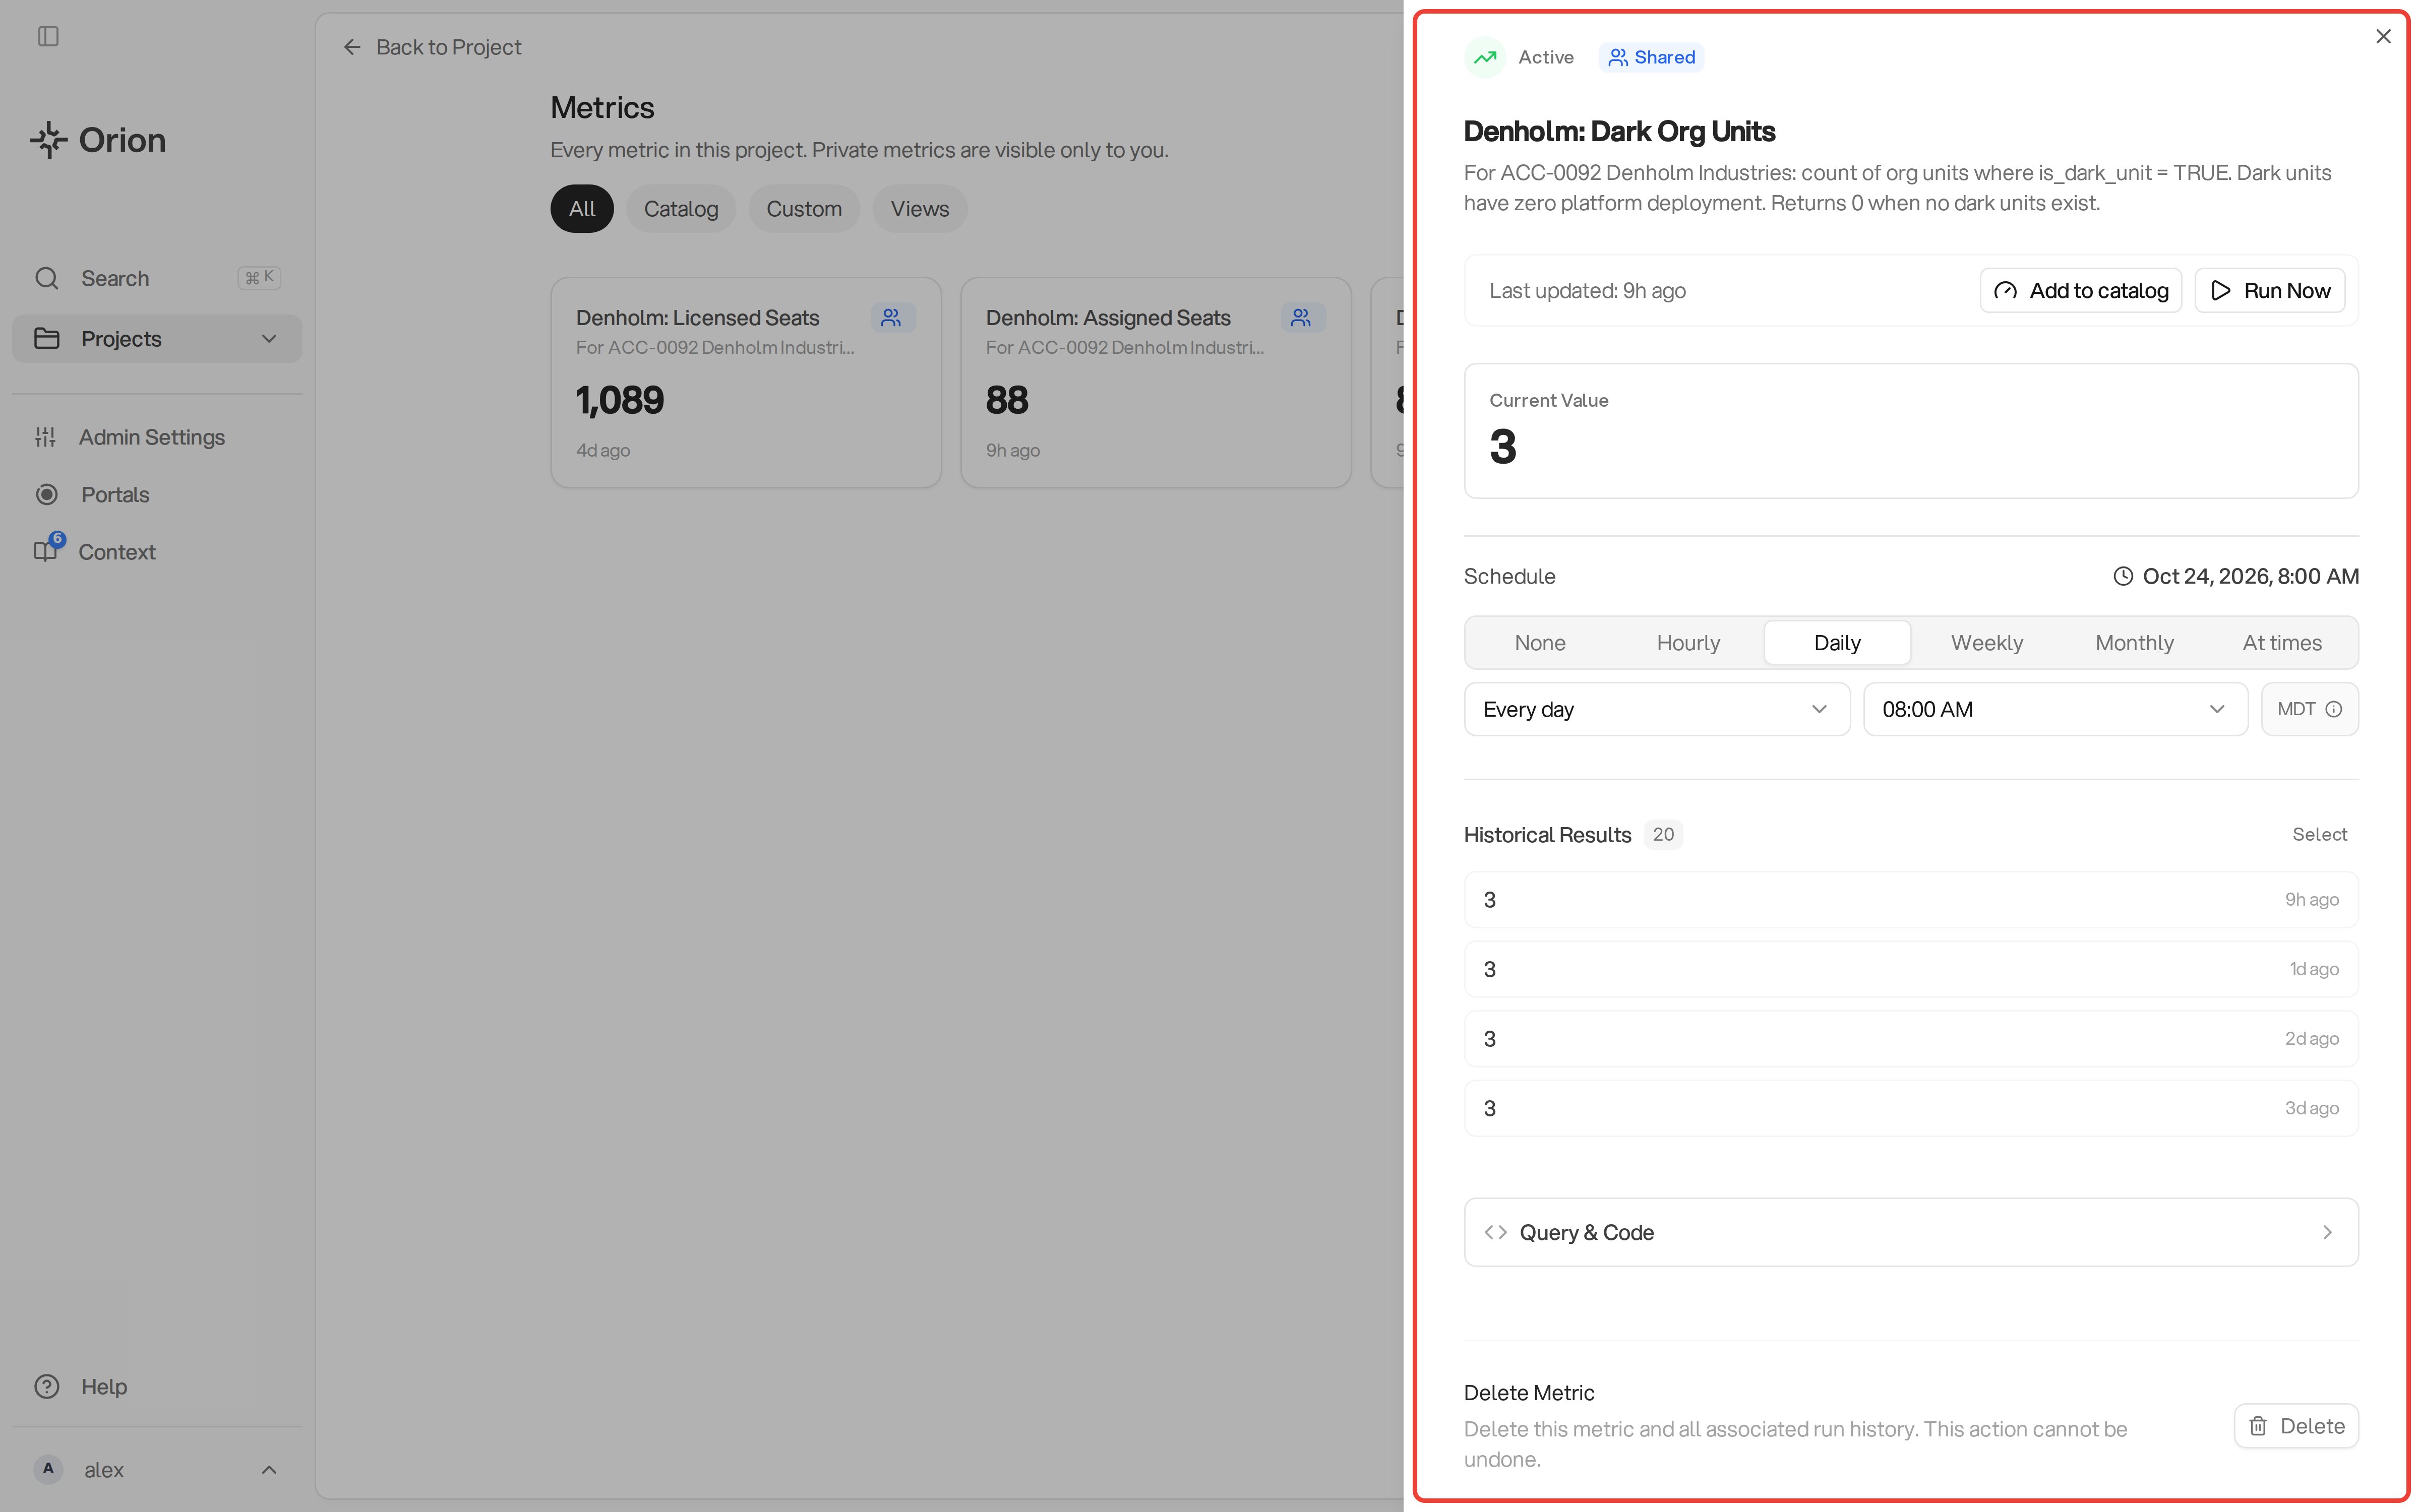
A metric's detail sheet
Visualizing results
Numbers, percentages, and currency render as a large formatted value. Field sets render as tiles, with a layout editor for choosing fields, labels, and formats. Table results can offer these tabs:- Table: inspect the result’s rows
- Chart: view a saved chart or a chart you are previewing
- Profile: inspect column summaries, such as ranges, common values, and missing values, when a profile is available
Adding or changing a chart
When Add chart appears in the detail sheet:- Select Add chart
- Choose one of the suggested chart types to preview it
- If Save as this metric’s chart appears, select it to use the chart on future runs. Cancel leaves the saved chart unchanged
- Edit chart: open the chart editor, when supported
- Change chart: preview another suggested chart, then save your choice
- Remove chart: remove the saved chart without deleting the table result
Scheduling
The Schedule section offers None, Hourly, Daily, Weekly, Monthly, and At times:- Hourly - Every 1, 2, 3, 4, 6, 8, or 12 hours, on the quarter hour you pick
- Daily - Choose days of the week, including presets for every day, weekdays, or weekends
- Monthly - A day of the month, 1st through 28th
- At times - Up to five specific times per day
When a data source is disabled
A Disabled pill on the schedule means a data source the metric uses is disabled. The schedule restarts once the source is enabled again. See Disabling a Data Source.Run history
Historical Results lists recent runs with their values. Failed runs carry an error icon, and table results expand inline. Select enters a selection mode for deleting runs that are no longer needed.Running catalog metrics
A catalog metric can reach a project as a Shared value or a Project copy. A Shared value uses the catalog’s run and result. It has no Run Now action in the project sheet. To run it:- Select Edit it there to open the metric in the catalog
- Open its … actions menu and select Run now, if you have permission to manage the catalog metric
Query & Code
The Query & Code section shows each data source with its variable name. SQL sources render with syntax highlighting, a plain-language summary of what the query does, and a diagram of how data flows through it. Looker sources show the query structure and link back to Looker. Sources and transformation code are read-only here. To change them, ask Orion in chat:- “Update the metric to exclude internal accounts”
- “Fix this metric” (after a failed run, Orion repairs the code)
- “Change the metric’s schedule to weekdays at 7am”
Previews and Full Results
Large results open as a preview. Select Load full table to see more rows, up to 100,000. A view shows a preview and a summary of each column. To work with all of its rows, select Open in chat and tell Orion what to calculate. A stored as view badge means the result was too large for a table, so Orion saved it as a view.Metrics in chat
- @-mention a metric in any chat to bring it into the conversation
- Ask “how is this metric calculated?” for its lineage: sources, transformation, and how data flows between them
- Ask Orion to load a metric’s history into an analysis to chart it over time or build it into a deliverable
Deleting a metric
Delete removes the metric and all of its run history, permanently. If a Workflow or notebook references the metric, deletion is blocked and Orion lists the dependents, so a scheduled Workflow cannot break silently. See Metrics as a source for how Workflows consume metrics.Permissions
These permissions apply to metrics you can access. A private project metric is available to its creator and Tenant Admins. Project owners and Group Admins cannot open another member’s private metric through their project role alone.- Viewers: read shared metrics and browse their history
- Analysts: run, rename, schedule, visualize, and delete accessible metrics. Sharing to the board is limited to metrics they created
- Project owners: can also change visibility on metrics they can access
- Tenant Admins: can also access private project metrics created by others and change their visibility